EN-KE
Topbar Menu Icon 1Help Centre
Topbar Menu Icon 2Contact Us
Company Logo
Trading
Our Markets
  • Forex
  • Commodities
  • Metals
  • Stocks
  • Indices
  • Cryptocurrencies
  • Futures
  • ETFs
  • Crosses
Our Accounts
  • Advantage
  • Advantage Plus
  • Advantage Stocks
  • Practice
Our Platforms
  • Desktop
  • Mobile App
  • MetaTrader 4
  • MetaTrader 5
Terms
  • Fees
  • Deposits and Withdrawals
  • Dividends Calendar
  • Contract Specifications
  • Leverage and Margin
Tools & Analysis
Market Analysis
  • Economic Events
  • Meet the Team
Tools
  • Pip Calculator
  • Profit Calculator
  • Currency Converter
  • Economic Calendar
  • Trading Schedule
Rewards & Promos
FXTM Rewards
    Promotions
    • Refer a Friend
    Learn
    Learn to Trade
      Popular Guides
      • Forex Trading for Beginners
      • CFD Trading for Beginners
      About
      About Us
      • Fund Safety
      • Blog
      Partners
      • Affiliates
      Terms and Conditions

        Week Ahead: Santa rally on deck for the US500?

        Week Ahead: Santa rally on deck for the US500?
        1. Home
        2. Market Analysis
        3. Week Ahead: Santa rally on deck for the US500?
        • US500 ↓ 1% month-to-date
        • December historically good month for stocks
        • ‘Santa Rally’ chatter + US data = fresh volatility
        • Trader’s pricing in 27% chance Fed cuts rates in January 2026
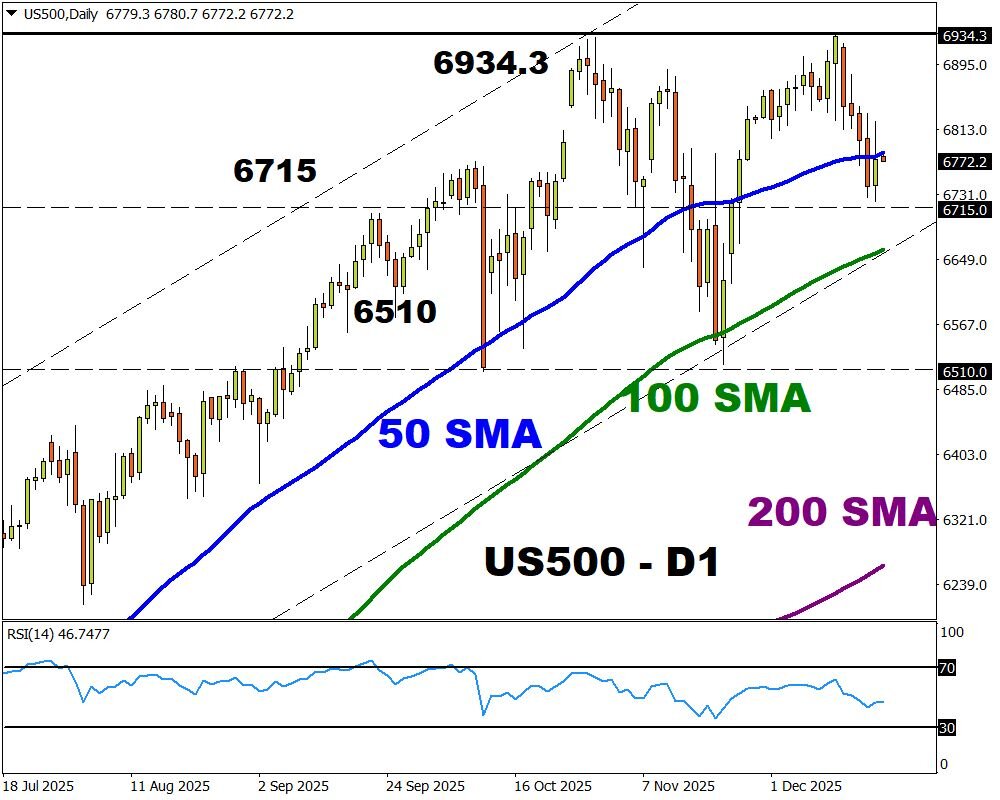
        • Technica levels: 50-day SMA, 6715 and 100-day SMA


        You better watch out, because a Santa Claus rally could be coming to town!

        December is historically one of the strongest months for the S&P500, with the index posting positive returns almost 80% of the time since 1950.

        And with Christmas just around the corner, market chatter around a potential ‘Santa Rally’ is poised to intensify:


        Monday, 22nd December

        • CNY: China loan prime rates
        • SPN35: Spain trade
        • TWN: Taiwan unemployment
        • GBP: UK GDP
        • USDInd: US Chicago Fed National Activity Index


        Tuesday, 23rd December

        • SG20: Singapore CPI
        • CAD: BoC meeting minutes
        • AUD: RBA meeting minutes
        • US500: US GDP, industrial production, durable goods, consumer confidence


        Wednesday, 24th December

        • TWN: Taiwan industrial production
        • US500: US initial jobless claims
        • US and most European markets close early on Christmas Eve.


        Thursday, 25th December

        • Christmas Day. Markets closed in the US, Canada and Europe.


        Friday, 26th December

        • JP225: Japan Tokyo CPI, unemployment, industrial production, retail sales
        • Boxing Day. Markets closed in the UK, Canada, Australia and some EU countries


        FXTM’s US500 jumped almost 1% on Thursday after US CPI unexpectedly slowed to 2.7% in November.

        However, the index is still down 1% month-to-date amid concerns over sky-high AI-fuelled tech valuations.

        Looking at the charts, prices remain somewhat bullish on the weekly charts - boasting gains of 15% year-to-date.

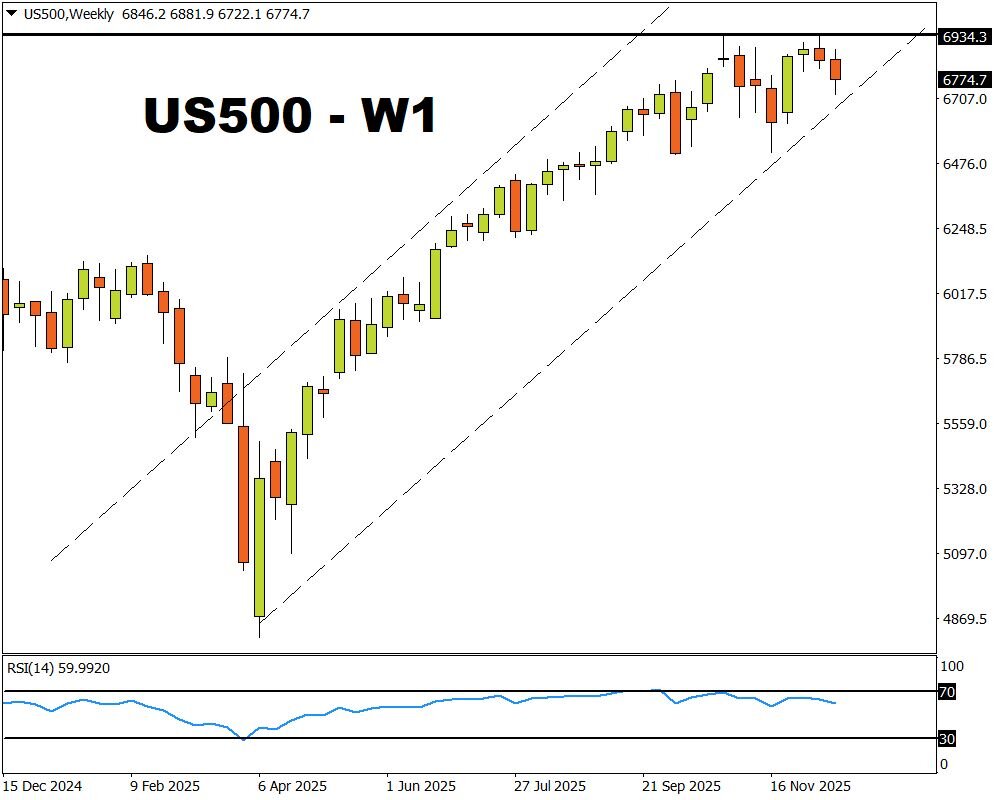
        With less than two weeks left until the end of 2025, the question is whether the US500 will end the month positively.


        Here are 3 factors to keep an eye on in the week ahead:


        1) ‘Santa Rally’ chatter

        As the countdown to Christmas enters its final stretch, anticipation may mount around a Santa Claus rally.

        This financial phenomenon is where stocks generally rally in the last week of December and the first two trading days of the new year.

        It is not fully clear whether it’s purely psychological or the product of some underlying financial forces, but history has shown that this is a recurring seasonal pattern.

        The Santa Claus rally has averaged a 1.3% gain on the S&P 500 since 1950.


        2) US economic data

        On the data front, a string of high-impact data releases may influence Fed cut bets beyond 2025. These include GDP, Industrial production, and consumer confidence, among other data releases.

        • The US500 is likely to trade lower if the stronger-than-expected data shaves the odds of a Fed cut in the first quarter of 2026.


        • Should weak data support the argument for faster rate cuts next year, the US500 may receive a boost.


        3) Technical forces

        The US500 is under pressure on the daily charts with prices wobbling around the 50-day SMA.

        • Should 6715 prove to be reliable support, prices may rebound back toward 6900 and the all-time high at 6934.3.


        • Weakness below 6715 may open a path toward the 100-day SMA and 6510.

        Week ahead
        Social Media Icon 1Social Media Icon 2

        Our offering

        • Markets
        • Accounts
        • Platforms
        • Tools
        • Trading terms

        Popular markets

        • Forex
        • Commodities
        • Metals

        Trading

        • Mobile App
        • MetaTrader 4
        • Metatrader 5

        Learn

        • Learn to trade

        Company

        • About us
        • Blog
        • Partners
        • Affiliates
        • Terms and Conditions

        Exinity Limited (www.fxtm.com) with registration number C119470 C1/GBL and registration address at 5th Floor, NEX Tower, Rue du Savoir, Cybercity, 72201 Ebene, Republic of Mauritius is regulated by the Financial Services Commission of the Republic of Mauritius with an Investment Dealer License with license number C113012295, licensed by the Financial Sector Conduct Authority (FSCA) of South Africa, with FSP No. 50320 and is a licensed Over the Counter Derivative Provider.

        Risk Warning: Trading Leveraged Financial instruments involves significant risk and can result in the loss of your invested capital. You should not invest more than you can afford to lose and should ensure that you fully understand the risks involved. Trading leveraged products may not be suitable for all investors. The value of shares can fall as well as rise, which could mean getting back less than you originally put in. Past performance does not guarantee future results. Before trading, take into consideration your level of experience, investment objectives and seek independent financial advice if necessary. It is the responsibility of the client to ascertain whether they are permitted to use the services of Exinity brand based on the legal requirements in their country of residence.

        Please read our full Risk Disclosure.

        Regional restrictions Exinity Limited does not provide services to residents of the USA, Mauritius, Japan, Canada, Haiti, Iran, Suriname, the Democratic People's Republic of Korea, Puerto Rico, the Occupied Area of Cyprus, Quebec, Iraq, Syria, Cuba, Belarus, Myanmar, Russia and India.

        logo
        We value your privacy
        We use cookies to give you the best-possible experience on our site and serve you personalised content. Click "Sounds good" to agree to our Cookie Policy.
        Sounds good